
| Data Set | Data File | Fields | Jpeg Image |
|---|---|---|---|
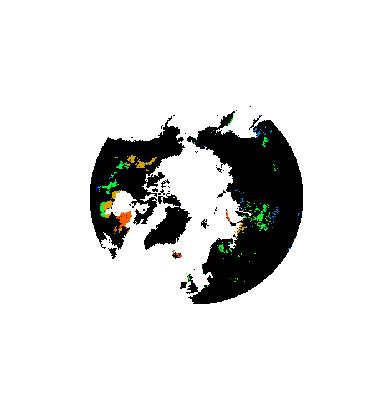
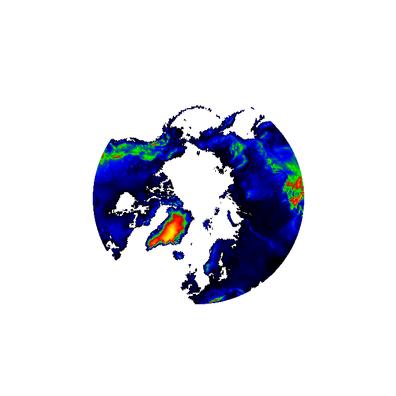
| Ground Ice Content | GroundIceContent2.ease.asc | GroundIceContent2.txt | GroundIceContent2.ease.jpg |
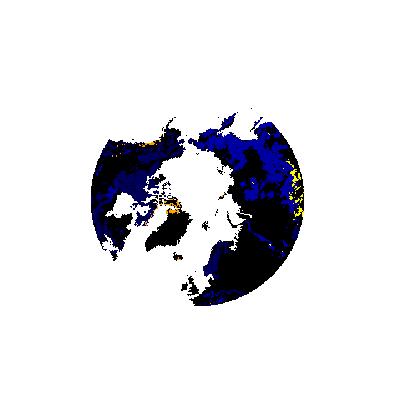
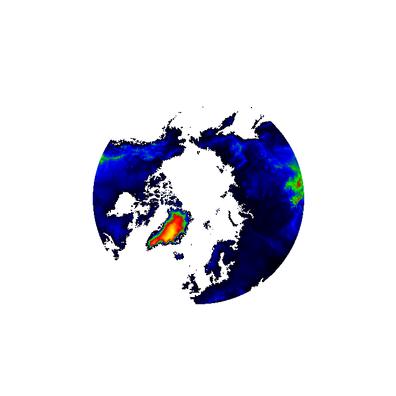
| Permafrost Extent | Permafrost_Extent2.ease.asc | Permafrost_Extent2.txt | Permafrost_Extent2.ease.jpg |
| Root Depth | RootDepth1999.ease.asc | RootDepth1999.txt | RootDepth1999.jpg |
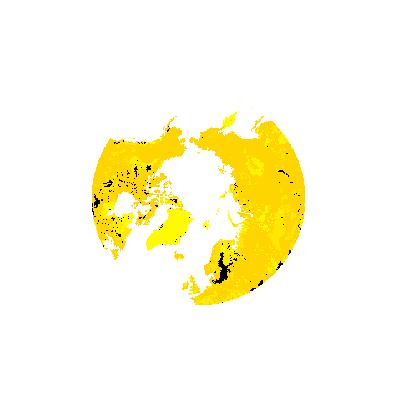
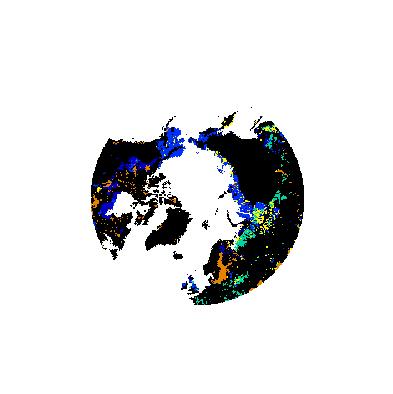
| Vegetation Cover | temveg2arctic1999.ease.asc | temveg2arctic1999.txt | temveg2arctic1999.jpg |
| Soil Texture | FAO.texture2.ease.asc | ** new
FAO.texture2.txt ** new README |
FAO.texture2.jpg |
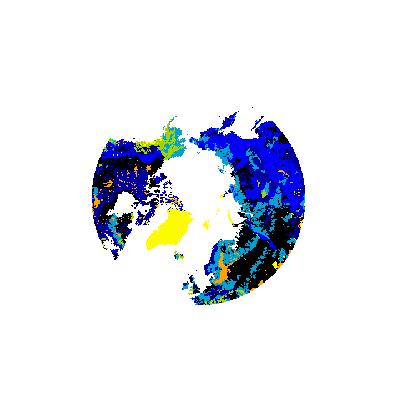
| Soil Type | FAO.soil2.ease.asc | FAO.soil2.txt | FAO.soil2.jpg |
| Soil Phase | FAO.phase2.ease.asc | FAO.phase2.txt | FAO.phase2.jpg |
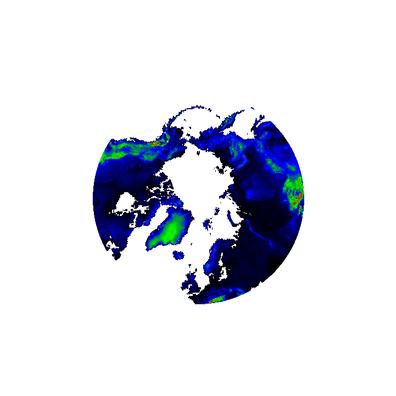
| Land Surface Gradient | FAO.slope2.ease.asc | FAO.slope2.txt | FAO.slope2.jpg |
| Wetlands | FAO.wetland2.ease.asc | FAO.wetland2.txt | FAO.wetland2.jpg |
| Elevation - Mean Minimum Maximum |
GtopoElevationMean.ease.asc
GtopoElevationMinimum.ease.asc GtopoElevationMaximum.ease.asc |
GtopoElevation.txt | GtopoElevationMean.ease.jpg
GtopoElevationMinimum.ease.jpg GtopoElevationMaximum.ease.jpg |
| All data | all_land_data.tar.gz | ||